Consolidated View of Information for Group of Companies

Import companies’ information after each individual company’s run to get an overall view of all companies combined. Salaries, increase and bonus information for your group of companies at your finger tips.

It is sometimes difficult to gather the information of all your companies’ remuneration data to firstly compare between the companies and secondly, to analyze the group’s information. RemCalc’s Company Consolidation View feature provides the ability to import all children companies’ information for a single consolidated view. Once all children companies’ increase and bonus processes are done, the information can be imported into the consolidation company for a full compensation analysis of the group.

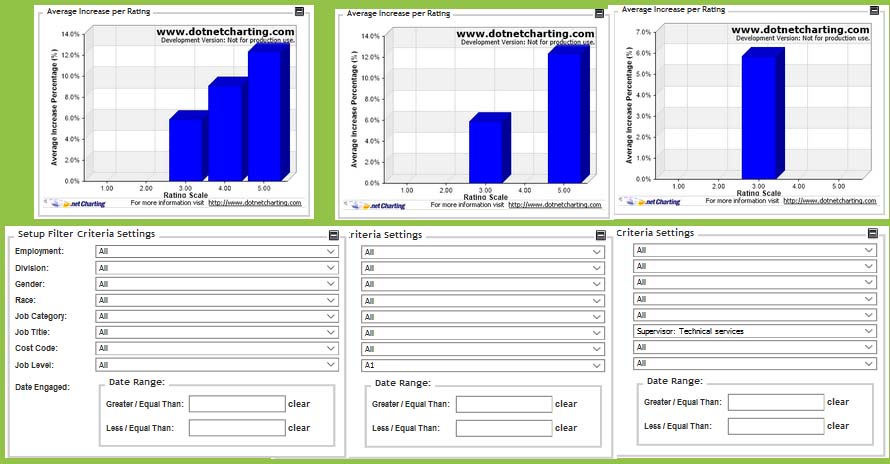
RemCalc offers visual graphs and reports from which you can obtain information on top and under performers within each company and how they compare for the same job grades and KPI scores across companies. Compare employees against salary benchmark lines setup for the consolidation company and get a better understanding by utilizing built-in filters to analyze your information e.g. gender salary distribution, remuneration parity gaps for each company, etc. .

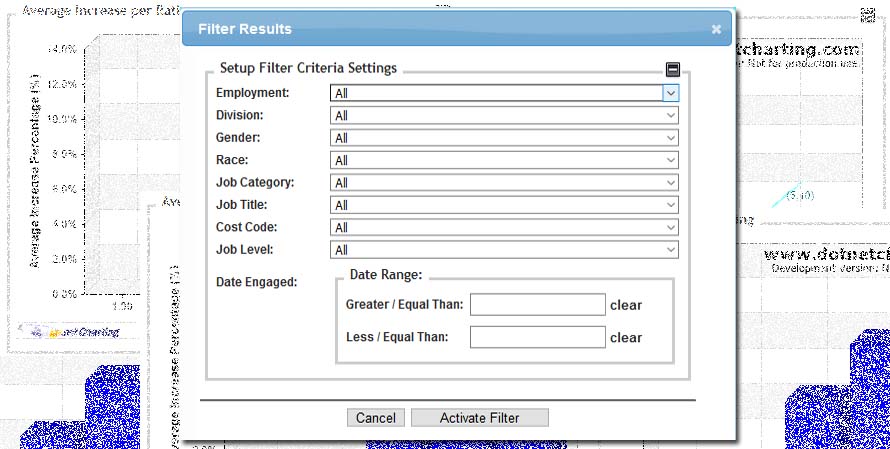
Analytical visual reporting just became a whole lot easier with RemCalc. Information can be filtered on the following criteria for comparison: Company: Employment, Division, Gender, Race, Job Category, Job Title, Cost Code, Job Level and Date Engaged.

Filters to Inspect and Compare Information Across Multiple Companies

By utilizing company filters within the application, you can view and compare your data across a group of companies while still being able to use other filter criteria.

Example 1: Average Increase Per Company

The below picture shows how you can use the built-in filters to compare the average increase per rating for all employees for a specified company (left hand column) versus the average increase for all employees from another company (middle column) versus all employees over all the companies in the group (right hand column).

Example 2: Average Increase for Employees on Specified Job Level

As a second example, the below picture shows how you can use the built-in filters to compare the average increase for all employees on job level A1 a specified company (left hand column) versus the average increase for all employees on job level A1 from another company (middle column) versus all employees on job level A1 over all the companies in the group (right hand column).

Available Built-in Filters on Information for multiple companies

The below built-in filter function allow for a comprehensive overview to view any criteria that is needed for detailed reporting of multiple companies to be displayed via visual graphs.

FILTER: COMPANY

Filter of information displayed on the dashboards or reports according to a selected company of the parent company.

FILTER: EMPLOYMENT

Filter of information displayed on the dashboards or reports according to the employment selected as criteria.

FILTER: DIVISION

Filter of information displayed on the dashboards or reports according to the division selected as criteria.

FILTER: GENDER

Filter of information displayed on the dashboards or reports according to gender selected as criteria.

FILTER: RACE

Filter of information displayed on the dashboards or reports according to the race of employees selected as criteria.

FILTER: JOB CATEGORY

Filter of information displayed on the dashboards or reports according to selected job category of a specific company selected as criteria.

FILTER: JOB TITLE

Filter of information displayed on the dashboards or reports according to job titles of a specific company selected as criteria.

FILTER: COST CODE

Filter of information displayed on the dashboards or reports according to the cost code selected as criteria.

FILTER: JOB LEVEL

Filter of information displayed on the dashboards or reports according to the job level selected as criteria.

View Compensation History Across Different Companies

By having the ability to view how compensation was spent across different companies it allows for easy reporting and keep track of how companies perform.

KEEP TRACK OF EMPLOYEES IN YOUR GROUP

View employees’ compensation history in a specific company to keep track of your top talent’s movement. Use this information to adjust your pay-for-performance strategy in a specific company to get more employees on board.

VIEW INCREASE PROCESS HISTORY FOR GROUP

Switch between different calculation periods to view and inspect the increase history for one of the companies in the group or analyze the increase history for the group as a whole for the calculation period.

VIEW BONUS PROCESS HISTORY FOR GROUP

Switch between different calculation periods to view and inspect the bonus history for one of the companies in the group or analyze the bonus history for the group as a whole for the calculation period.

HISTORIC DASHBOARDS AND REPORTS FOR GROUP COMPANIES

When adjusting your pay-for-performance strategy, previous calculation periods’ dashboards and reports can be analyzed to make better informed decisions as a parent company for all the other companies.